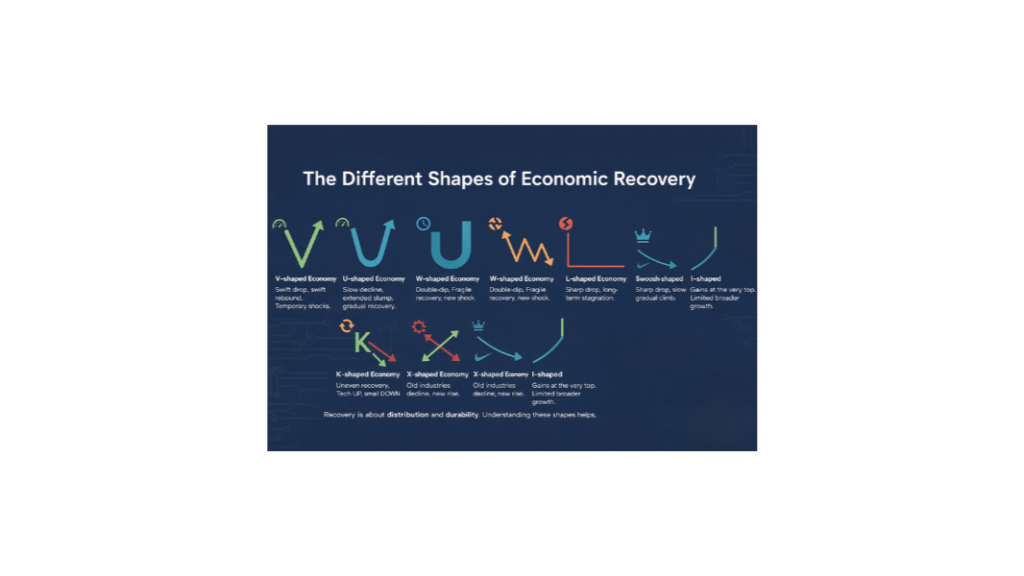
When we talk about economic cycles, we often reduce complex realities into simple shapes. These “shaped economies” are practical ways to understand how growth, recovery, and inequality play out across countries, industries, and income groups.
While the K-shaped economy has become a familiar term in recent years, it is only one of several models economists use to explain how economies behave after a shock.
V-shaped Economy
A V-shaped economy represents the most optimistic recovery pattern. Economic activity falls sharply during a crisis but rebounds just as quickly. Output, employment, and consumer confidence return to pre-crisis levels in a short span of time. This usually happens when disruptions are temporary and policy responses are swift and effective.
Example: United States after the initial COVID-19 shock in 2020, supported by large fiscal stimulus and rapid reopening.
U-shaped Economy
A U-shaped economy signals a slower healing process. After the initial decline, the economy remains weak for an extended period before gradually recovering. Businesses take longer to restart investments, unemployment stays elevated, and confidence returns cautiously. Many recessions caused by structural weaknesses rather than sudden shocks tend to follow this pattern.
Example: Global economy following the 2008 financial crisis, where recovery took several years before growth stabilised.
W-shaped Economy
The W-shaped economy, often called a double-dip recession, describes a fragile recovery. The economy shows early signs of improvement, only to slip back into another downturn before finally stabilising. This can occur when stimulus measures are withdrawn too early or when new shocks hit before the recovery is firmly established.
Example: United States in the early 1980s, when aggressive interest rate hikes led to two recessions close together.
L-shaped economy
An L-shaped economy is the most concerning scenario. After a sharp decline, the economy fails to recover meaningfully for years. Growth remains subdued, job creation is weak, and long-term damage sets in. This pattern is often associated with financial crises or deep structural problems that are difficult to resolve quickly.
Example: Japan after the 1990 asset bubble collapse, followed by decades of low growth and deflation.
K-shaped Economy
The widely discussed K-shaped economy highlights uneven recovery. Certain sectors, companies, or income groups grow rapidly, while others continue to struggle. High-skill workers, asset owners, and technology-led industries move upward, while low-income workers, small businesses, and traditional sectors fall behind. This model draws attention to inequality rather than overall growth numbers.
Example: Post-COVID recovery globally, where technology firms and asset owners grew rapidly while small businesses and informal workers struggled.
X-shaped Economy
An X-shaped economy reflects economic transition. Legacy industries decline as new sectors rise and replace them. While overall output may stabilise, the shift can be disruptive for workers and regions tied to older industries, even as new opportunities emerge elsewhere.
Example: Global transition from fossil fuels to renewable energy, with coal-related industries declining as clean energy sectors expanded.
Swoosh-shaped Economy
The Swoosh-shaped economy describes a sharp decline followed by a long, gradual recovery. Unlike the V-shape, momentum builds slowly. Confidence, employment, and investment return in stages rather than all at once.
Example: Many European economies after COVID-19, experiencing slow and extended recoveries due to prolonged restrictions.
I-shaped Economy
Finally, the I-shaped economy is often used to describe extreme concentration of gains. Growth exists, but it flows almost entirely to the top, with limited improvement for the middle and lower segments of society.
Example: Post-pandemic period in developed markets, where wealth and market gains accrued largely to the top income groups.
These economic shapes remind us that recovery is about distribution and durability, just as much as it is about speed.
Understanding these patterns helps policymakers, businesses, and individuals read beyond headline growth numbers and recognise who is truly moving forward and who is being left behind.